Biomedical Imaging Group Software Overview
Over the last three decades, the BIG has written and validated a large collection of software tools
(hundreds of programs) for image acquisition, processing, analysis and visualization, image restoration,
computer vision, and the modeling and simulation of biological systems. The bulk of this software is written in
C, as well as in Fortran, C++, Perl, Java and Matlab. These programs range from the simple (e.g., add/subtract/multiply/divide
images; perform global thresholding, etc.) to the complex (e.g., deformable models to identify the plasma
membrane of a cell). The following is a description of many of the programs, roughly sorted by category.
Some of the larger or more important programs are listed at the end with a short description and a link to
a separate web page which provides further information.
Note: a much more complete list of BIG software is described here
This software was written, primarily, by BIG members Kevin Fogarty ,
Lawrence Lifshitz (this includes an overview of my research areas and a full bibliography) , and Karl Bellve .
Generating Random Data/Simulations:
- CellSim : Simulates chemical reactions and diffusion in 3D cells.
- connected_random_pts : Generates random points in a planar region, calculates how many connected components are created if a point is connected to
all other points within a given radius.
- cross_sections_of_voronoi : Creates a random 3D voronoi tessellation and 2D image (cross-section) from it.
- ellipse : Creates an elliptical cell. It is used to model a squashed cell, and see how different it looks after blurring from a cylindrical cell.
- makebeads2 : Randomly distributes beads within a volume; created to simulate the distribution of
glut4 labeled vesicles in the TIRF field of a microscope.
- oxygen : Calculates steady state partial oxygen pressure (P) as a function of distance from a blood vessel (r).
- random_paths.pl: Generates a random path (ie, diffusion of a single particle).
- vcspat : Calculates complete spatial randomness (Ripley's K function) of punctates in a volume.
- vcspat-models: Drops random objects in a volume. Objects can either be individual voxels, tiny images, or connected voxels in an image.
Statistics:
- coloc3way image1[.i2i] image2[.i2i] image3[.i2i] [coloc-image[.i2i]] : Calculates two-way and three-way binary image colocation.
- overlap3: Produces a whole set of numbers with colocalization for each of many offset directions of one image relative
to the other (to compensate for slight mis-registration between the images).
Finding events, Tracking:
- exo6 : Identifies vesicle fusion events in a 2D time series.
Intensity maxima are tracked, then each is analyzed to see if it meets the criteria to be a fusing vesicle.
- track : Tracks regions over time. Tracks written to stdout in rpts format.
This is done by thresholding the input image. Resulting connected voxels define regions.
Uses one of 3 tracking algorithms, lots of parameters can be specified to customize the tracking algorithm.
- trackinfo.pl : Analyzes output from track.
- track_pts : This programs takes a list of initial points in a 3D image and tracks them over time. It uses hill climbing
or the brightest point in the neighborhood to link to in the next time point.
- paths4.pl : Reads tracking information from *.txt files, generates statistics for each
track (speed, pathlength, distance, curvature). Statistics printed to stdout. There are lots of filtering and analysis options.
Miscellaneous:
- parse_macros.pl (and associated .pl files) : Produces layered ImageJ macro files with variables passed through between them.
This makes it much easier to write ImageJ macro programs which call other ImageJ macro programs. All of the parameter flags
available in the called program are automatically propagated up to the calling program and made available to be set.
- diffusion2 : Uses VTK to diffuse (and visualize) random points in a volume.
- find_blobs : Uses maxima and zero crossings of the 2nd derivative to find blobs and their spatial extent; works in multiple resolutions.
- thin3Ds: This program is for thinning (i.e., finding the skeleton or medial axis) 3D objects.
It is modified from Lee, Kashyap, and Chu (a parallel algorithm). thin3Dp is the same but in parallel.
- channel_current2 : Calculates the current which would be produced when each object in a Ryanodine labeled image releases
calcium (e.g, a "spark") which activates nearby BK channels also labeled in the image (in a different wavelength).
- morph3d : Performes morphological processing on grayscale images.
- pwarpL : pwarp warps an image into a new image based upon a set of registered points from one image to the other.
A line segment can also be specified as an old "point". The new point will match the best position along this line segment.
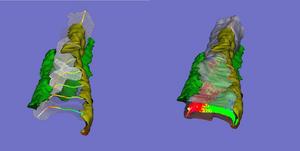
Shrinkwrap - a Deformable Surfaces program
 We have developed and implemented a deformable surface model
[Lifshitz, L. M., Fogarty, K. E., Gauch, J. M. & Moore, E. D. W. "Computer vision and graphics in
fluorescence microscopy". Visualization in Biomedical Computing, SPIE vol. 1808, 521-534 (1992)], called "shrinkwrap" which has been used numerous
times over the years to locate the plasma membrane of fluorescently labeled cells. The model is composed of
vertices spaced along a model surface, which is initially placed within a 3D image, near its correct location.
Each vertex is then allowed move in response to image intensity gradients, attempting to move to locations in
the image with a higher intensity while imposing a cost based upon how much curvature its position would
impose onto the surface. Our implementation calculates curvature measures (i.e., first and second derivatives
of the surface) and intensity measures locally and quickly. This results in a fast algorithm, which is also easy
to modify to handle additional local constraints.
We have developed and implemented a deformable surface model
[Lifshitz, L. M., Fogarty, K. E., Gauch, J. M. & Moore, E. D. W. "Computer vision and graphics in
fluorescence microscopy". Visualization in Biomedical Computing, SPIE vol. 1808, 521-534 (1992)], called "shrinkwrap" which has been used numerous
times over the years to locate the plasma membrane of fluorescently labeled cells. The model is composed of
vertices spaced along a model surface, which is initially placed within a 3D image, near its correct location.
Each vertex is then allowed move in response to image intensity gradients, attempting to move to locations in
the image with a higher intensity while imposing a cost based upon how much curvature its position would
impose onto the surface. Our implementation calculates curvature measures (i.e., first and second derivatives
of the surface) and intensity measures locally and quickly. This results in a fast algorithm, which is also easy
to modify to handle additional local constraints.
Other programs related to finding the surface of a smooth muscle cell and performing related analysis:
- Corecell.pl : Takes a 3D image and an outline and keeps all data points within the specified distance of the outline
(removes the "core" of the cell). It runs shrink_wrap and uses its results to do this.
- histogram2: This program creates a number of histograms of signal intensity (e.g., Calcium label) or volume as a function of distance of the object
voxels from the nearest background voxel. If the "background" voxel represents the plasma membrane of a cell, the
volume (or signal intensity, eg, Calcium) histogram this program produces describes, e.g.,
what percentage of the cell volume (or, eg, Calcium) is within 1 um of the plasma
membrane. The volume histogram can be used to determine if intracellular objects are distributed randomly within the cell.
Changes in the signal intensity histogram over time can indicate movement of signal (e.g., Calcium) within the cell.
- analyze_histo: Rather than apply a single threshold value to an entire image, this program produces a different threshold for each
distance from the plasma membrane. It analyzes the histograms produced by histogram2 to calculate these thresholds.
Different thresholds may be needed since signal intensity levels may vary as a function of distance from the plasma
membrane and therefore noise levels (due to non-specific signal and/or Poisson noise) may also depend upon that distance.
- map_to_surface : This program takes a surface (which are those voxels which are nonzero) and one (or two) data images.
It then maps (moves) the data voxels (nonzero voxels) to the position of the nearest surface voxel.
It can be the first step in deciding (for example) whether cellular structures just below the plasma membrane
are distributed randomly "on" the plasma membrane (a not infrequent question posed by physiologists).
- distance2surface_overtime.pl :
Finds the distance (in pixels) of a specified point (over time) from the nearest pixel
greater than 0 in a 3D image. Alternatively, it finds the distance to the boundary surface specified with the -surface option.
Written to take a tracked gene in the nucleus and find its distance to the nuclear envelope over time.
CellSim - simulating chemical reactions and diffusion in 3D cells.
Cellsim [Kargacin, G., and F.S. Fay. 1991. "Ca2+ movement in smooth muscle cells studied with one- and two-dimensional diffusion model"
Biophys. J. 60:1088-1100. and Zou, H.L., M. Lifshitz, R.A. Tuft, K.E. Fogarty, and J.J. Singer. 1999.
"Imaging Ca2+ entering the cytoplasm through a single opening of
a plasma membrane cation channel". J. Gen. Physiol. 114:575-588. ]
is a program for 3-D reaction and diffusion simulation. Cellsim uses a Forward Time Centered
Space fully explicit differencing scheme to solve the associated PDEs. Cellsim can run in parallel using MPI.
Cellsim models multiple species of diffusible molecules and their reactions (e.g. ions and their binding targets).
The simulation is saved as a series of images at specified time intervals. Images explicitly describing flow
(since there can be large flow yet no net change in concentration) can also be saved.
DAVE - Interactive quantitative visualization of multidimensional image data
 The Data Visualization and Analysis Environment
[Lifshitz, L. M., Collins, J. A., Moore, E. D. W. & Gauch, J., "Computer vision and graphics in
fluorescence microscopy". IEEE Workshop on Biomedical Image Analysis, Seattle, 1994. pp. 166-175. doi:10.1109/BIA.1994.315854]
is a real-time interactive software system for displaying
and analyzing multi-wavelength, 3-D, time-series images. DAVE simultaneously displays up to three image
stacks, in red, green and blue. The images can be displayed as 2-D slices or full 3-D volumes, using several
different methods for volume rendering. Surfaces (polygonal) or outlines (polyline) can be simultaneously
displayed with volumes. Time series can be interactively reviewed in real-time, with selected time points held
on screen for visual reference. Pixels or voxels of co-localization among the three images sets can be visually
highlighted, segmented, and quantified50 . DAVE calculates percentage of overlap of regions of images, and the
probability that such overlap could have occurred randomly. DAVE can render voxels as an individual cubes
when the location or value of an individual voxel is desired. An "intelligent" 3-D cursor automatically snaps to
the brightest nearby voxel when clicked. DAVE can remotely synchronize with another instance of DAVE, thus
researchers in different locations see and interact with the same exact views.
The Data Visualization and Analysis Environment
[Lifshitz, L. M., Collins, J. A., Moore, E. D. W. & Gauch, J., "Computer vision and graphics in
fluorescence microscopy". IEEE Workshop on Biomedical Image Analysis, Seattle, 1994. pp. 166-175. doi:10.1109/BIA.1994.315854]
is a real-time interactive software system for displaying
and analyzing multi-wavelength, 3-D, time-series images. DAVE simultaneously displays up to three image
stacks, in red, green and blue. The images can be displayed as 2-D slices or full 3-D volumes, using several
different methods for volume rendering. Surfaces (polygonal) or outlines (polyline) can be simultaneously
displayed with volumes. Time series can be interactively reviewed in real-time, with selected time points held
on screen for visual reference. Pixels or voxels of co-localization among the three images sets can be visually
highlighted, segmented, and quantified50 . DAVE calculates percentage of overlap of regions of images, and the
probability that such overlap could have occurred randomly. DAVE can render voxels as an individual cubes
when the location or value of an individual voxel is desired. An "intelligent" 3-D cursor automatically snaps to
the brightest nearby voxel when clicked. DAVE can remotely synchronize with another instance of DAVE, thus
researchers in different locations see and interact with the same exact views.
EPR - Image Restoration and super-resolution.
Over 20 years ago the BIG pioneered the development of image deconvolution for light microscopy and the
resulting EPR algorithm 25 remains one of the best. EPR uses the light microscope's point spread function
(PSF) in an iterative process to move out-of-focus light back to its originating position. Unlike many image
restoration algorithms it is guaranteed to converge, and when given a finely-sampled point spread function it
has been shown to increase lateral image resolution beyond the diffraction limit to less than 100 nm/pixel25.
When combined with structured light microscopy (i.e. Structured Light Epifluorescence EPR or SLEEPR) it can
achieve resolutions better than 50 nm laterally and 250 nm axially. EPR is computationally demanding. Original versions of this
software were written by Kevin Fogarty. More recently Dr. Bellvé has produced
both cluster-enabled and GPU versions of EPR,
the latter of which can now restore images in seconds on a single workstation,
make EPR for the first time amenable for High-Througput, high-speed and intelligent acquisition modalitis.
SignalMass - quantifying intracellular calcium microdomains.
SignalMass [ZhuGe, R., Fogarty, K., Tuft, R., Lifshitz, L., Sayar, K., and Walsh, J.
"Dynamics of signaling between Ca(2+) sparks and Ca(2+)- activated K(+) channels
studied with a novel image-based method for direct intracellular measurement of ryanodine receptor
Ca(2+) current". J Gen Physiol 116, 845-864 (2000).] is program for the analysis of
fast, time-lapse images of live cells loaded with a fluorescent calcium indicator for spatially and
temporal local (microdomain) events (flashes of light) representing the release of calcium from internal stores through events called
calcium "sparks" and "puffs".
During a Ca2+ "spark", free Ca2+ and Ca2+ bound to fluo-3 quickly diffuse away from the spark release site as Ca2+ continues to be discharged. To quantify the total fluorescence (and, ultimately the total Ca2+ discharged) arising from the binding of fluo-3 to the discharged Ca2+(i.e., the Ca2+ signal mass), the increase in fluo3/fluo4 fluorescence ) must be collected from a sufficiently large volume (and in 3D) to provide a measure of the total quantity of Ca2+ released.
This software was written by Kevin Fogarty.